Drift diagnostics: Tasks 10 and 11 diagnostic / conditional
Codex results read from your files, plus my mean-flow check on your forcing cache. Frozen B0 physics, assumed find coordinates and dates, zero-delay matching. State as of 6 Oct 2026: boxes B, W and M are finished through stage 2, the permutation null and delay runs are in, B1 stopped at Step A, and the Task 16 source-region likelihood is complete. The E box was not run because the forcing domain ends at 115°E.
What the results say, in short
- The western focus is not shown to depend on the finds. Both nulls keep the western receiving geography, so the Task 9 result is weak evidence about cause.
- The model under-delivers westward motion in drifter tests. The median zonal error is positive (model too far east) at 180 days in all four starting regions and all three splits. The size is about 100–340 km. This is a plausible contributor to a source placed too far west. It is not shown to explain the plume.
- Mean currents in the release box are weak. The model's 1.2% wind-slip term is as large as the mean current or larger in every latitude band, so transport depends heavily on the assigned slip and the unvalidated wind and Stokes treatment.
- No source region can be determined, and now we know why. With a graded likelihood and a detection term, the method recovers synthetic sources it knows are there, but on the real finds the answer moves 1,000 to 1,900 km when an unmeasured assumption changes — further than any single answer is wide. The obstacle is identifiability, not computation.
- No single release cell supplies the collection. Under the primary rule the best cell matches 7 of 32 items, which is 3 to 4 independent date windows. Réunion-matching cells match at most one other item.
- The B1 bias fit stopped at Step A. The calibration data support none of the three registered correction forms (current scale, wind slip, constant drift), so no correction was fitted and the model stays frozen. The eastward bias is documented but has no supported fix.
- The permutation null finds nothing. No box and class set has its best cell beyond the shuffle at the 0.05 level (0 of 30 tests), and W and M look like B. Réunion timing separates W from B and M, not B from M.
- Zero-delay matching favours distant sources. It cannot be used to prefer the 80–100°E box over nearer boxes.
Task 10: where does the western focus come from? complete
| Check | Result |
|---|---|
| Scope of the nulls | The shuffled null can change the joint mixture of location, dates, classes and jitter. Both nulls retain western receiving geography. |
| Inputs and zero-motion test | Launch tables differ as intended. Zero-motion differences are zero. |
| Attrition, original N2 run (16,000) | 6,602 survive · 5,725 land · 3,664 leave the domain · 9 invalid forcing |
| Contributors to the western peak (observed replicate 1) | C2 64%, C3 30%, C1 6%. C2 is untestable and C3 unsupported as measured classes. All entered the last 11.68 h hold, as every event survivor must. |
| Denominator variants | Peak moves 414 km between pooled and equal-item smoothing. Changing only the pooled denominator leaves it unchanged. |
| Checkpoint divergence | Shuffled total variation 1.000 at start → 0.454 at event (minimum 0.352 at 360 d). Random coast 0.096 → 0.585. No common convergence interval. |
| Synthetic recovery (original 5-site design) | Untestable: 0–2 matched items per site under the primary rule, 0–7 under the regional rule, none reach all 32. No reverse set was substituted. |
| Ring distance | Task 9 peaks are 726–1,059 km inside the full ring (earlier values used the truncated arc). |
Task 11, Step E: drifter hindcast of the frozen model
NOAA GDP drifter tracks, known-track transport tests with the frozen B0 model (daily NCEP wind, K = 10 m²/s, absorbing mask, wind slip floor of 1.2%). C0 is the pre-declared primary undrogued proxy. These are not flaperon proxies.
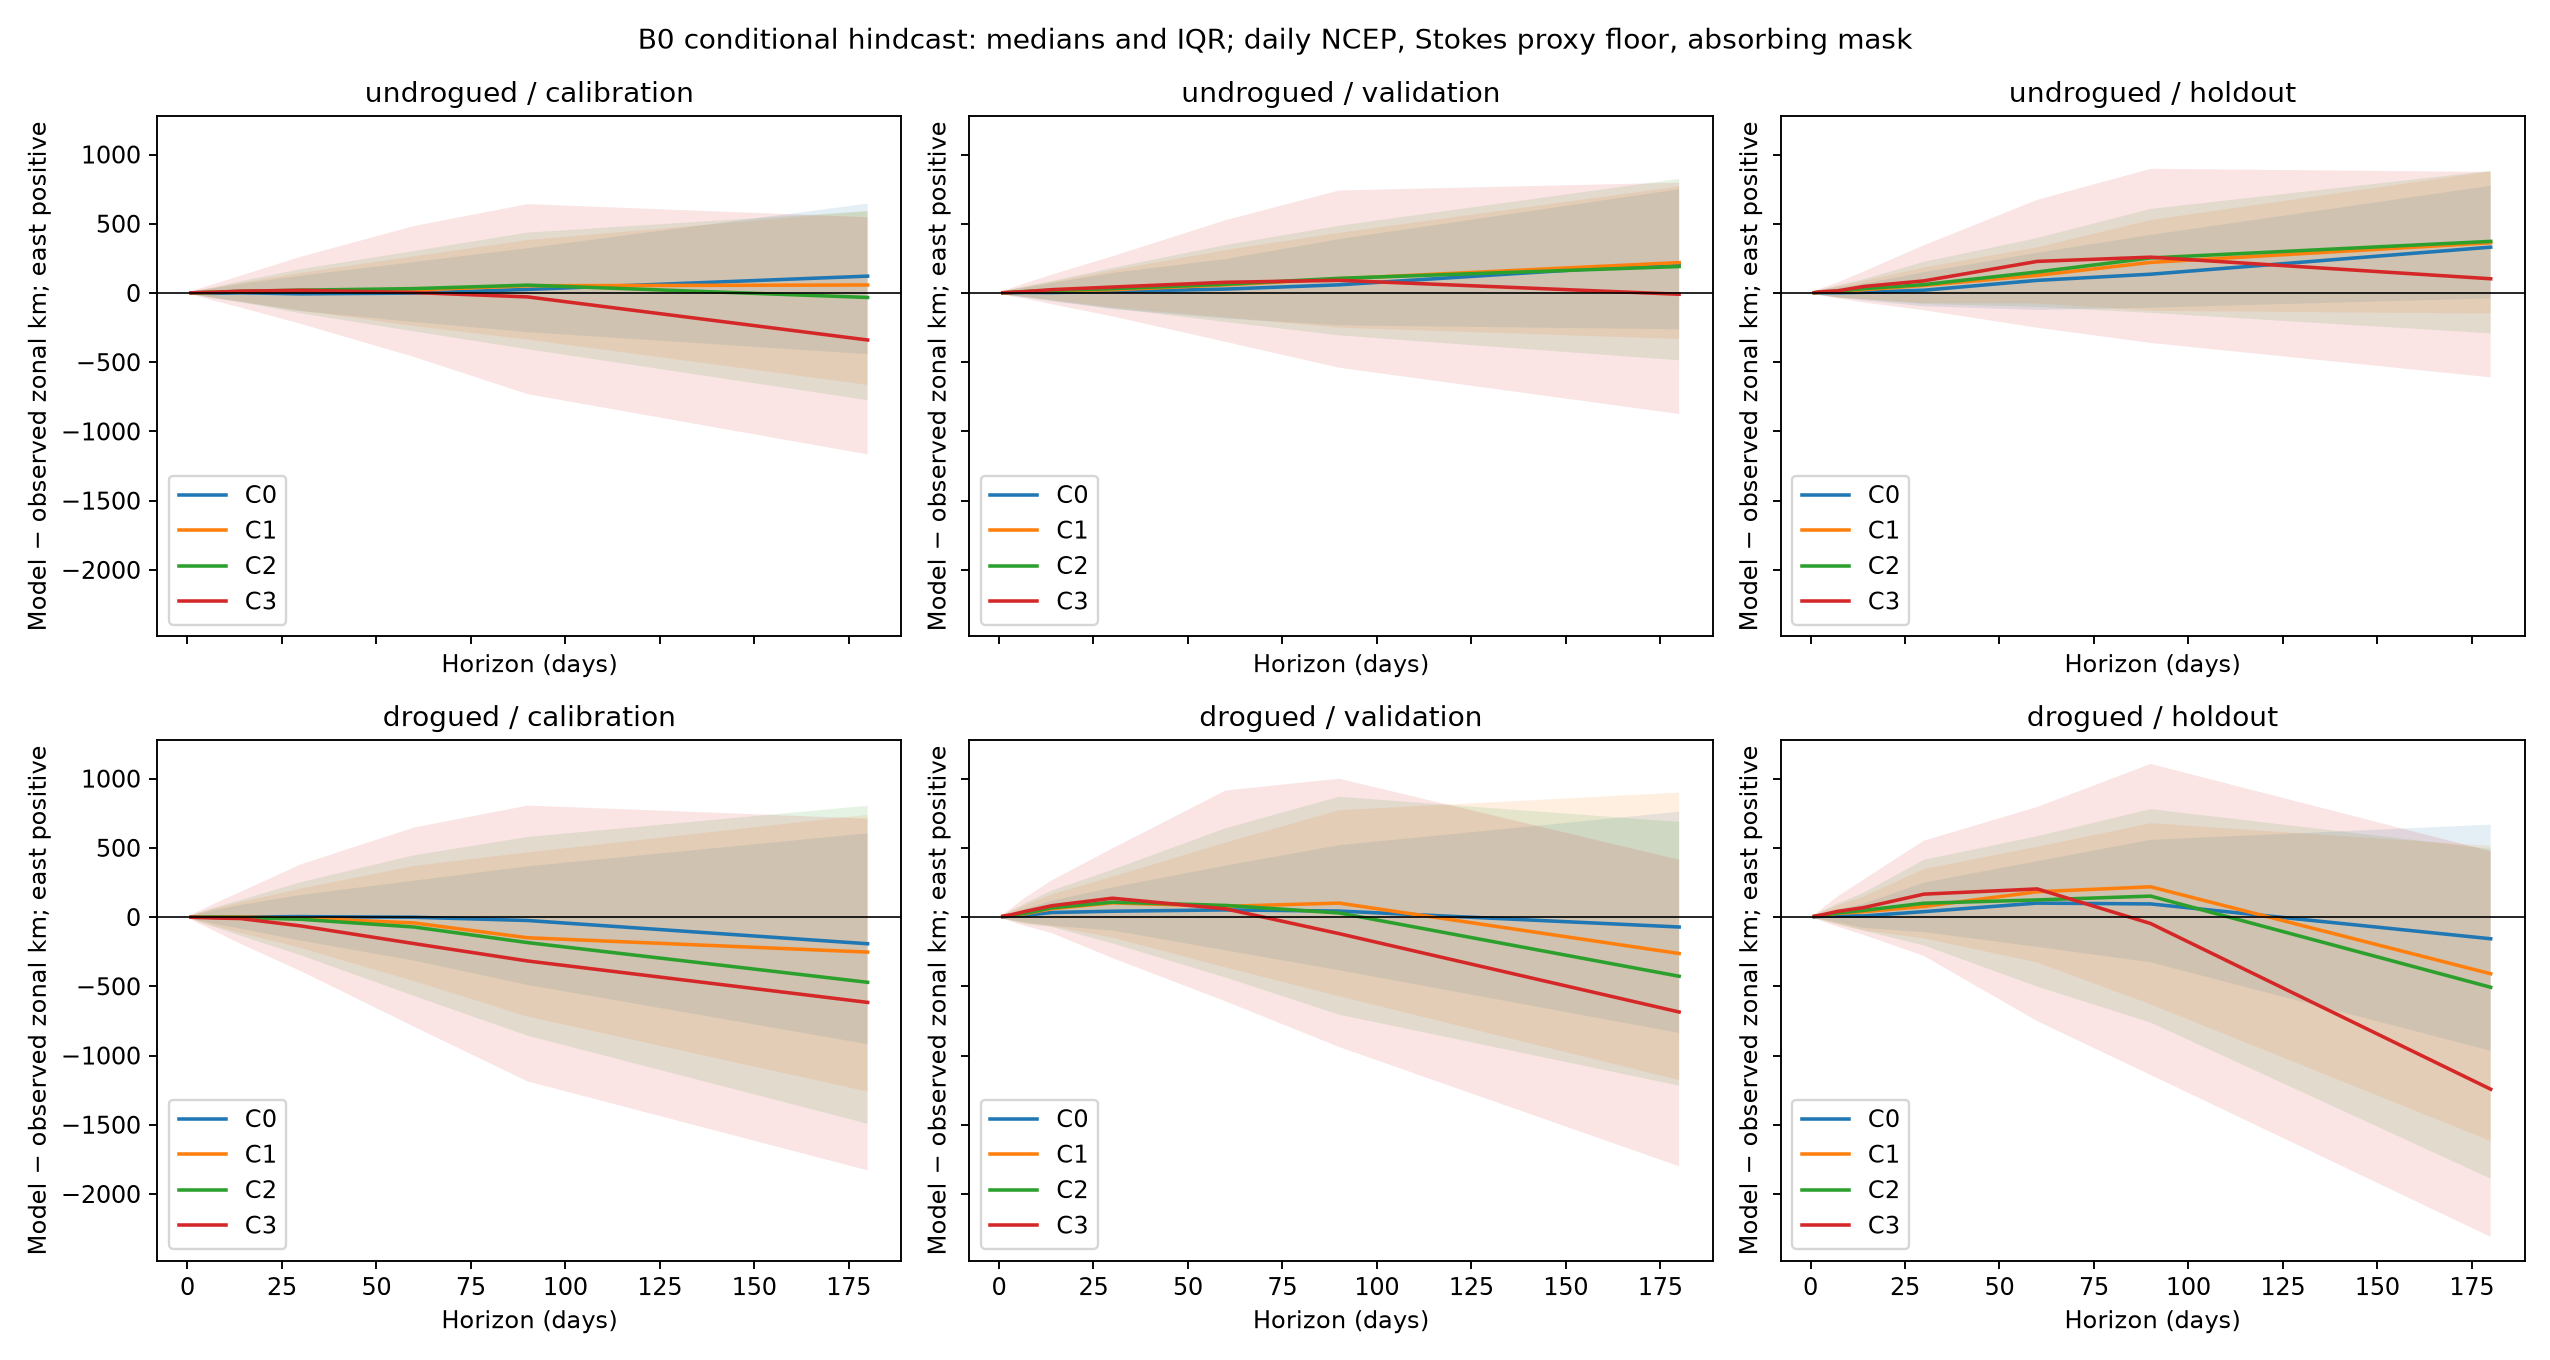
Median and interquartile range, east positive, by drogue status and split (Codex figure).
Holdout, C0 undrogued, all directions
| Horizon d | Median error / persistence km | Skill | Zonal error median [IQR] km |
|---|---|---|---|
| 1 | 12.65 / 20.98 | 0.398 | +1.0 [−6.5, 7.7] |
| 3 | 31.48 / 55.91 | 0.418 | +1.8 [−16.7, 20.6] |
| 7 | 58.78 / 107.17 | 0.414 | +2.1 [−31.5, 39.0] |
| 14 | 98.73 / 172.35 | 0.349 | +4.8 [−53.1, 66.7] |
| 30 | 204.88 / 318.70 | 0.294 | +19.9 [−96.3, 150.1] |
| 60 | 362.89 / 523.72 | 0.303 | +91.1 [−122.8, 290.2] |
| 90 | 491.87 / 699.81 | 0.319 | +135.5 [−106.3, 419.7] |
| 180 | 824.95 / 1139.85 | 0.314 | +330.9 [−39.0, 774.1] |
No frozen criterion failed for C0 undrogued (the pre-declared primary). C2 and C3 do fail some criteria, see the Task 12 section below. The pre-set B1 trigger (all-direction calibration errors at 7 and 14 d) was false. That design cannot see an effect that only appears after about 30 days.
Median zonal error at 14 d / 180 d by starting region, C0 undrogued, both directions (km)
| Start longitude | Calibration | Validation | Holdout |
|---|---|---|---|
| Western 40–55°E | +0.8 / +111.7 | +3.1 / +171.5 | +4.1 / +311.9 |
| Transit 55–80°E | +2.5 / +106.0 | +19.6 / +278.1 | +10.4 / +342.7 |
| Source 80–100°E | −1.9 / +105.0 | −14.3 / +159.7 | −3.4 / +340.7 |
| Eastern >100–110°E | +4.8 / +338.9 | +5.2 / +199.1 | +13.6 / +112.5 |
All 14-day IQRs span zero. At 180 d the holdout source and transit IQRs are entirely positive (+6.6 to +827.3 and +2.5 to +720.8 km).
Observed-westward subset, C0 undrogued, 180 d
| Split | Median [IQR] km |
|---|---|
| Calibration | +396.8 [−137.5, 943.1] |
| Validation | +488.2 [−82.7, 1,000.5] |
| Holdout | +473.3 [+95.1, +946.2] (observed −754.5) |
Task 11, Step F: forward release from 24.5–41°S, 80–100°E (box B)
1,394 cells at 0.5°, 100 particles per cell per class, released 8 Mar 2014 00:19, classes C0–C3 separately, frozen B0 physics. Stage 1 integrates to 31 Jul 2015 (only item 1, Réunion, is scored). Stage 2 continues offshore particles to the end of the last find interval (day 1,638). Controls W (40–60°E) and M (60–80°E) use 25 particles per cell per class.
Accounting against released mass, box B
| Stage | Released | Landed | Left domain | Invalid | Offshore at horizon |
|---|---|---|---|---|---|
| 1 (day 510) | 557,600 | 116,607 (20.9%) | 146,548 (26.3%) | 886 | 293,559 (52.6%) |
| 2 (day 1,638) | 557,600 | 252,840 (45.3%) | 210,285 (37.7%) | 2,686 (0.5%) | 91,789 (16.5%) |
Accounting residual is zero for every class and stage. Stage 2 landed by class: C0 75,044 · C1 65,358 · C2 60,100 · C3 52,338.
Where left-domain particles exit (box B, stage 2)
| Edge | Particles | Median day |
|---|---|---|
| East, 115°E | 135,596 (64%) | 178 |
| North, 5°N | 40,304 (19%) | 548 |
| West, 20°E | 34,124 (16%) | 985 |
| South, 55°S | 261 (0.1%) | 171 |
For release cells at 36–41°S, 93% of leavers exit east. In total 24% of every particle released leaves by the east edge, so the closed domain boundary removes mass that could recirculate in the real gyre.
Matching, box B, stage 2 (all 32 items scored)
| Rule · class | Cells with ≥1 match (of 1,394) | Max items by one cell | Max distinct date windows | Cells matching Réunion |
|---|---|---|---|---|
| Primary · C0 | 898 | 7 | 4 | 1 |
| Primary · C1 | 428 | 5 | 3 | 4 |
| Primary · C2 | 160 | 6 | 3 | 7 |
| Primary · C3 | 68 | 3 | 1 | 3 |
| Primary · assigned | 146 | 5 | 3 | 4 |
| Regional · C0 | 1,297 | 15 | 7 | 1 |
| Regional · assigned | 733 | 10 | 4 | 4 |
There are 23 distinct date windows across the 32 items. Items 13, 14, 16, 17 and 18 share one window, so one landing counts for five items. The best primary cell (34°S, 92.5°E, C0, 110 km inside the ring) matches items 13, 14, 16, 17, 18, 24 and 31 but not Réunion. Under the primary rule no release cell matches items 2, 6, 7, 9, 20 or 27.
Réunion (item 1, window day 508–509) matches 15 of 557,600 particles. Cells that match it match at most one other item, and that one has a wide window (day 938–1,395).
Controls W and M against B, stage 1 (Réunion region)
| Box | C0 median arrival day | C1 | C2 | C3 | Exact-date matches |
|---|---|---|---|---|---|
| B 80–100°E | 404 | 369 | 355 | 294 | 1 / 4 / 7 / 3 (C0–C3) |
| M 60–80°E | 301 | 203 | 183 | 142 | 0 |
| W 40–60°E | 161 | 130 | 124 | 97 | 0 |
In stage 2, box W has no cell matching Réunion either, and its best cell matches 5 items under the primary rule (2 date windows). Box M stage 2 is now complete (see the follow-up below).
Task 11 follow-up: permutation null, delay sensitivity, controls M and W complete, 6 Oct
Source: MH370_requested_diagnostics_v1.zip (frozen B0, stage 2, all 32 items, 23 distinct date windows). Zero-delay counts reproduce the saved summaries in all 66,000+ cell/class/rule rows. B1 stopped at Step A (next section).
Common-source permutation null (1,000 shuffles of window hit flags among cells)
Observed maximum number of distinct windows matched by one cell, against the null. Stage 2, 30 tests (3 boxes, 5 class sets, 2 rules).
- Tests with corrected tail probability ≤ 0.05: 0 of 30. ≤ 0.10: 4. ≤ 0.15: 6. About 3 and 4.5 would be expected at the last two thresholds if nothing were there.
- Smallest tail probabilities: M C3 regional 0.064, B C2 regional 0.071, W assigned regional 0.079, B C0 regional 0.095.
- Box B, assigned classes, primary rule: 3 windows observed, null mean 2.1, tail 0.115. Regional: 4 windows, null mean 3.9, tail 0.86.
- Reading: window hits are not more concentrated in single cells than the shuffle produces, in any box. The grid does not pick B over W or M. This is a conditional diagnostic. The shuffle destroys spatial coherence, and with 1 to 7 windows per cell its power is low. It does not show that there is no common source.
Delay sensitivity (delay added to first land hit)
The maximum number of distinct windows for C0 is unchanged by delay: B primary 4, 4, 4, 4; W 2, 2, 2, 2; M 3, 4, 3, 3 at 0, 30, 90, 180 d. Raw items rise slightly (B primary 7 to 10). Beach residence does not create a convergent source in these runs.
Réunion (item 1, one-day window 29 July 2015), primary rule, stage 2
| Box | Class | Released | Before window | Inside | After | Landed 0–180 d before |
|---|---|---|---|---|---|---|
| B | C0 | 139,400 | 570 | 1 | 2,983 | 408 (0.29%) |
| B | C1 | 139,400 | 779 | 4 | 1,462 | 490 (0.35%) |
| B | C2 | 139,400 | 858 | 7 | 965 | 509 (0.37%) |
| B | C3 | 139,400 | 947 | 3 | 212 | 360 (0.26%) |
| M | C0–C3 | 34,850 each | 306–701 | 0 | 57–947 | 87–138 (0.25–0.40%) |
| W | C0–C3 | about 34,400 each | 160–273 | 0 | 81–412 | 21–32 (0.06–0.09%) |
- Exact-day landings are very rare (B 15 of 557,600 across classes at zero delay; W and M none). The last column is my own derivation: it is the fall in the "before" count between delay 0 and delay 180 d, so it counts particles that landed 0 to 180 d before the window. That is the fraction that matches if an undetected beach residence of up to 180 d is allowed.
- B and M give similar fractions (0.25–0.40%). W gives about five times less, because its particles arrive earlier than 180 d before the find. Réunion timing therefore separates W from B and M, but not B from M.
- A delay added to the landing time is the right sign for "found after it landed". It is an assumption, not data: no residence time, refloat or detection delay is measured.
Limits
Cell samples are 100 particles in B and 25 in W and M (smallest nonzero fraction 1% and 4%). The per-item intervals are pooled and do not cover between-cell differences. Window 5 (items 28, 29, 31, 32) spans 15 months and window 0 one month, so the wide windows are easy to hit; the shuffle preserves each window's prevalence. Class assignment, assumed find coordinates, daily NCEP winds, no explicit Stokes, the 1.2% floor, the static absorbing coast and noon boundary holds remain assumptions.
Task 12 (B1 bias fit) and the final Task 11 report complete, 6 Oct
B1 stopped at Step A, as registered. Using calibration drifters only (C0 undrogued, 139 to 179 drifters), none of the three correction forms was supported at both 90 and 180 days. Steps B, C and D (fit, gates, corrected grids) were not run, so there is no corrected model. This is exploratory and post-hoc, because the holdout has been seen.
- Speed scale: not supported. Regressing observed on modelled zonal displacement gives a slope of 0.91 at 90 d and 0.92 at 180 d (model too fast). The total-least-squares fit gives 1.14 and 1.15 (model too slow). The two bracket 1, and the true value depends on an error ratio nobody has measured. So the data cannot say which way the scale is off.
- Constant offset: not supported for the zonal direction (intercept interval includes 0 at both horizons). Meridionally, the intercept is +66 km at 90 d and +88 km at 180 d and excludes 0, but the slope (0.64 to 0.78) fails the pure-offset rule.
- Wind response: not supported. The error against mean wind has slope intervals that include 0 at both horizons (180 d zonal: −9.9 km per m/s, interval −36.6 to +17.5).
This does not show the model is unbiased. It shows the calibration data do not identify one of the three allowed fixes under the declared thresholds. The 100 to 340 km eastward error at 180 d stays a documented limit.
Class gates from the final report (undrogued drifters)
| Class | Result against the frozen drifter criteria |
|---|---|
| C0 (primary) | Passes every criterion in all three splits. |
| C1 | Fails only the 180 d endpoint criterion on the calibration split. |
| C2 | Fails the 90 d endpoint criterion in all splits and 180 d in two. |
| C3 | Fails the 14 d endpoint and skill criteria and all longer endpoint criteria, in all splits. |
Why this matters: in the Task 10 reverse run, C2 and C3 supply 64% and 30% of the western peak. Those are the two classes with the weakest drifter support. A failure on drifters says that high wind slip is not plausible for objects that mostly follow the water. It does not say the slip is wrong for a flaperon, whose slip is not measured.
Réunion arrival over the full horizon (box B, stage 2)
| Class | C0 | C1 | C2 | C3 |
|---|---|---|---|---|
| Median Réunion arrival day (find at day 508) | 814 | 591 | 530 | 326 |
Box B delivers 8,791 particles to Réunion over the full horizon, 97,600 to Madagascar and 24,736 to Mozambique. Arrival at a coast is not the same as exact-date recovery.
Coastline sensitivity
Replacing only the beaching rule with the GSHHG coast changes the landed fraction by −12 to +8 percentage points across the sampled cells and classes. The paired median difference in first-hit position reaches 963 km. The coast treatment is therefore a first-order assumption for any landing-location result here. The comparison keeps the original missing-current areas, so it is not a pure geometric bound.
Synthetic recovery and the eastern control
All five fixed synthetic sites matched no items under either rule at this sample size, so no synthetic observation set formed and no reverse peak was computed for them. Control E (100–120°E) was not run because the box extends past the forcing domain at 115°E.
The report's own decision table: forward reproduces the collection is NOT ESTABLISHED, and conditional mismatch among source, object and observation assumptions is SUPPORTED WITH LIMITATIONS. No source location is established or excluded.
Gyre and mean-flow check (mine, from your forcing cache)
Mean daily surface current (0.494 m GLORYS, cache on your computer), weekly sample of 73 days over the first 510 days, averaged to 0.5°. Mean winds from the atlas's monthly NCEP file, assuming it is stored in hundredths of m/s (it gives about 5 m/s, which is plausible). Nothing here is a new transport run.
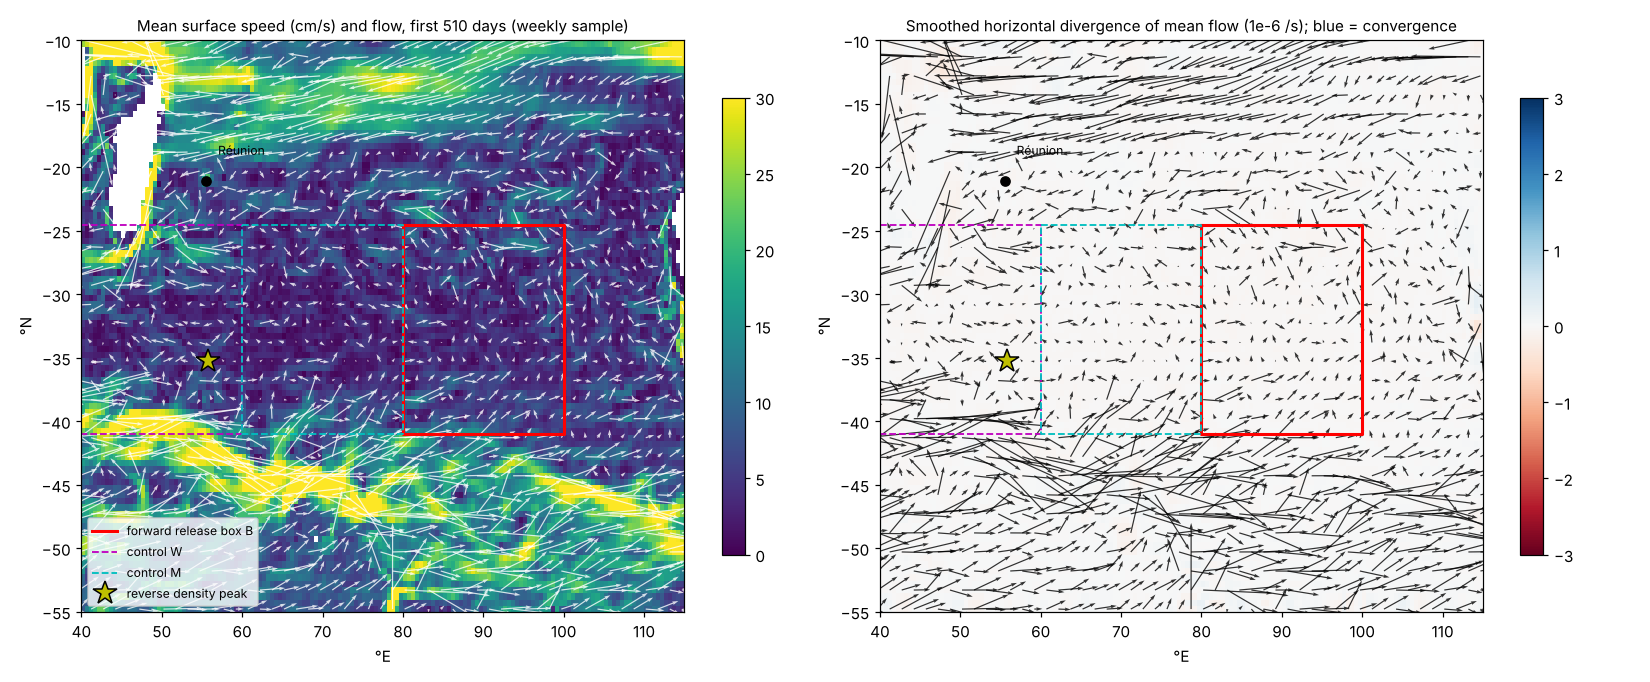
Mean zonal drift, 80–100°E (cm/s, east positive)
| Latitude | Mean current | 1.2% wind slip |
|---|---|---|
| 36–41°S | +4.7 | +6.2 |
| 31–36°S | +1.5 | +1.3 |
| 26–31°S | −0.8 | −3.1 |
| 21–26°S | −1.5 | −6.3 |
The hindcast bias (0.6–2.2 cm/s) is the same size as the whole mean current in the gyre interior. Slip and wind therefore dominate the transport, and a few tenths of a percent in slip is as large as the bias.
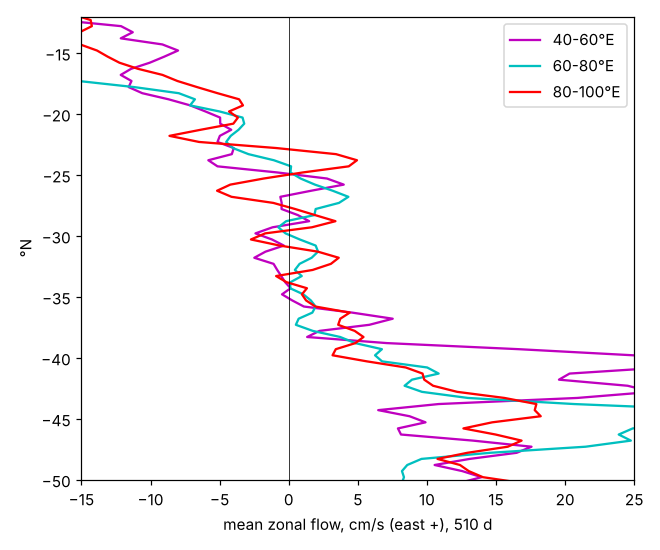
Mean zonal flow by latitude, three sectors.
Task 16: can a source region be determined at all? complete, 6 Oct
The binary rule (100 km, exact interval, zero delay) found nothing and the permutation null said its best cells matched a shuffle. Task 16 replaced hit-counting with a likelihood: a distance kernel instead of a hard radius, a landing-to-discovery delay distribution instead of a fixed offset, and — for the first time — an explicit detection term, since every item was found on populated accessible coast and none on uninhabited shoreline. 36 configurations: three kernel scales × three delay means × four detection models.
The gate passed, so this is not a power problem
Before touching the real finds, the method had to recover sources it knew were there. Synthetic collections were drawn from known cells in the same particle bank and scored blind against preregistered thresholds. 32 of 36 configurations passed, with HPD50 coverage from 41.0% to 97.5%; the four failures fell below the 60% bar. Only 0 to 3.5% of draws were unformable, so nearly every cell can produce a 32-item collection. The machinery works where a source exists.
On the real finds, the answer is set by the assumptions
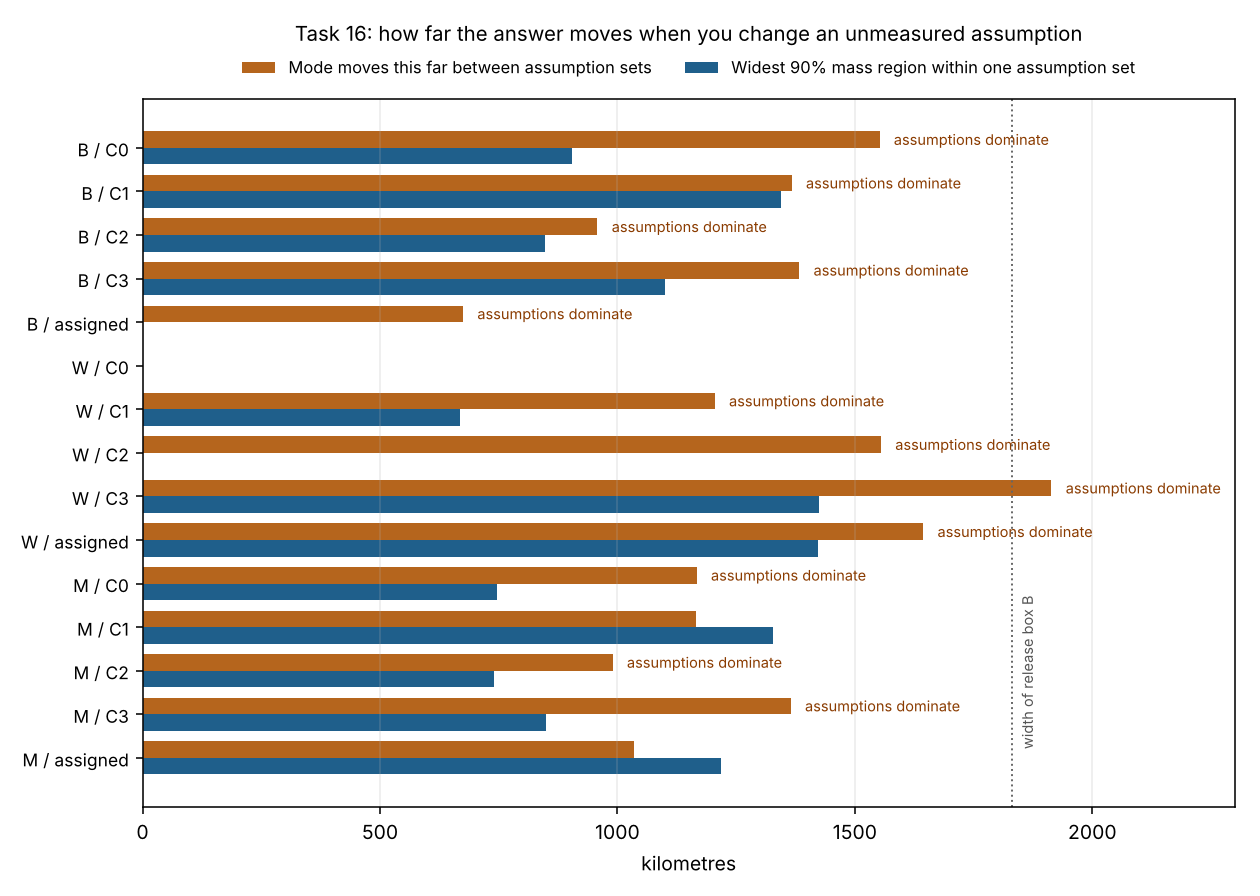
Orange exceeding blue means the preregistered failure condition is met: the answer moves further when you change an unmeasured assumption than any single answer is wide.
| Box / class | Mode spread across configurations | Widest 90% region | Verdict |
|---|---|---|---|
| B / C0 | 1,552 km | 905 km | assumptions dominate |
| B / C1 | 1,367 km | 1,345 km | assumptions dominate |
| B / C3 | 1,383 km | 1,101 km | assumptions dominate |
| B / assigned | 675 km | 0 km | assumptions dominate |
| W / C3 | 1,914 km | 1,424 km | assumptions dominate |
| M / C0 | 1,167 km | 747 km | assumptions dominate |
Thirteen of fifteen box/class combinations fail the test; only M/C1 and M/assigned come in under their widest configuration, which is already a generous comparison. Authoritative per-subset flags are in configuration_spread.csv.
What this does and does not mean
- It is not a failure of the data to contain signal. The gate shows the method localises a source when one is there under these assumptions. The problem is identifiability: find coordinates, detection probability, retention time and slip class are all unmeasured, and each choice of them yields a different confident answer.
- The recovery test is optimistic by construction. The same particle bank generates and scores the synthetic finds, generation is conditional while the scoring sum uses marginal contributions, so it is a composite likelihood. Passing is weaker than it reads and is not independent transport validation.
- The detection weights are judgement. D1 is my three-level ordinal ranking, not measured detection rates. D2 was never available and no proxy was acquired. D3 is circular by construction and is labelled on every row and separated in every map.
- The plumbing is sound. Binary primary and regional counts reproduce exactly, and all 1,049 historical files verified unchanged by streamed hashing, with arc, flight, candidate and contact contents never parsed.
This is the same wall reached from two other directions: Task 12 found no supported correction for the transport bias, and Tasks 13 and 14 found the inputs unmeasured. More computation cannot move it.
Provenance audit: what the inputs actually rest on Tasks 13 and 14, 6 Oct
Task 13 catalogued what the project files state about the five open inputs (805 rows across 32 items, 387 sourced rows resolving, 344 of 344 historical hashes unchanged). Task 14 then checked nine claims from an external source index against the documents themselves. Seven of nine documents were obtained; eight claims verified, one locator mismatch, two unobtainable. Nothing was promoted to a model input and no value changed.
The 1.2% wind-slip floor: resolved, and not in the model’s favour
The CSIRO 2016 report’s forcing products are confirmed: ERA-Interim 10 m winds, BRAN2015 currents, and Stokes drift from a CAWCR Wave Hindcast extension. The 1.2% is defined there as the value minimising the unexplained velocities of undrogued drifters — an effective windage fitted to that particular combination of products.
Still no measured slip for any item
The French DGA report’s 3.29% and 2.76% coefficients were confirmed as numerical-model results, not measurements — its cover and conclusion pages identify the method. Nesterov’s 2018 paper describes the same parameters as experimentally established, which the original report contradicts; that conflict is recorded and left unresolved. Neither those values, nor the mean flaperon deflection near 16° from CSIRO Part II, nor a fitted effective windage, map onto the C0–C3 slip minima, maxima or divergence widths. They are different quantities measured on a different object. The class table stays an assumption.
Item 4 (“Roy”, Mossel Bay): the matching window is probably wrong
The CSIRO report records Roy as first seen at Mossel Bay on 23 December 2015. The Malaysian catalogue gives a discovery date of 22 March 2016, and B0 uses that as a one-day matching window. The gap is about 90 days.
This is not a drop-in replacement, because it changes the kind of constraint: item 4 stops being “landed on day 745” and becomes “ashore by day 655”, an upper bound the matching rule has no mode for. It is flagged, not changed. The delay-sensitivity runs already bound how much it could matter: shifting every landing by 30, 90 and 180 days left the maximum distinct-window count unchanged in every box, and one item moving is a smaller perturbation than that.
The general point carries further than the one item. All 32 windows are discovery dates. One is demonstrably 90 days later than its own first sighting, and nothing establishes that the other 31 are better. That is an argument about the zero-delay exact-interval rule as a whole.
Coordinates: unchanged, and one claim did not survive
An external claim of an explicit flaperon coordinate at Saint-André, Réunion (20°56.20′S, 55°40.87′E) from a 2016 Météo-France report could not be verified: the report was not found locally or at its publisher, and the corroborating press page was unreachable. No mirror or search-index text was substituted. The verified side of that conflict is the Malaysian catalogue’s Saint-Denis. The two are 20 to 25 km apart, so both sit well inside the 100 km matching radius and nothing about matching changes either way. Item 6’s examination report was read in full, images included: it gives dimensions but no coordinate or extent. Every page of the items 28–32 report was read; no finer recovery dates exist, so those broad windows stay broad.
All five original gaps still affect all 32 items. Coordinates remain ASSUMED_GEOCODE with no stated centroid construction or extent, so the “wider than 100 km” check cannot be run at all.
Appendix: failed or superseded readings and open items
- Superseded: my first reading of the hindcast figure ("no sign of a westward deficit"). With the regional table the eastward error is positive in all 12 regional medians at 180 days.
- Doubtful: a single current-speed scale for B1. The error is positive in every direction, which looks more like an additive offset or a wind-response error than a speed that is too low. A regression check comes before any fit.
- Not valid as a test: stage 1 common-source counts. Only item 1 is scored in stage 1, so the maximum is one by construction.
- Not executed: the E box (100–120°E), residence-time tracks, and any corrected-model grid (B1 stopped at Step A, so none was fitted). The permutation null, delay runs and B1 Step A are reported above.
- Superseded: the stage 1 median Réunion arrival days (294 to 404) are truncated at day 510; use the full-horizon medians. The apparent conflict with Task 7 was an artifact of that.
- Resolved, 6 Oct: the CSIRO wind source. The 1.2% was fitted with ERA-Interim winds, BRAN2015 currents and a CAWCR wave hindcast; B0 uses NCEP winds and GLORYS currents, with no transfer validation. See the provenance card above.
- Known defect, not corrected: item 4’s one-day window is about 90 days later than its own first sighting. Flagged, not changed.
- Unverified external claim: the Saint-André flaperon coordinate. Its source document could not be obtained. Not adopted.
- Ryan to confirm: find coordinates and extents, class assignments and measured slip and divergence (none exist in any obtained document), wind and Stokes adequacy (ERA5 and WAVERYS are not used, and the full WAVERYS subset is absent), beach residence and refloat, detection delay, and the discovery-time versus first-beaching-time assumption.